Your Investment journey
What is “Your investment journey”?
Part of becoming a client of Rathmore will entail assessing your suitability to have your money invested in areas other than cash accounts:
Our 3-Step Investment Process:
- Understanding your comfort with risk and capacity for loss
- Volatility - Building/selecting the right portfolio
- Matching you to and reviewing that portfolio

Step 1: Understanding your comfort with risk and capacity for loss
We start by getting to know you — your goals, time horizon, and how comfortable you are with market ups and downs.
We’ll ask simple questions to understand:
- How much short-term fluctuation you can tolerate
- How long you plan to invest
- How you view the balance between longer-term returns and shorter-term volatility
This helps us clearly define your personal risk profile.
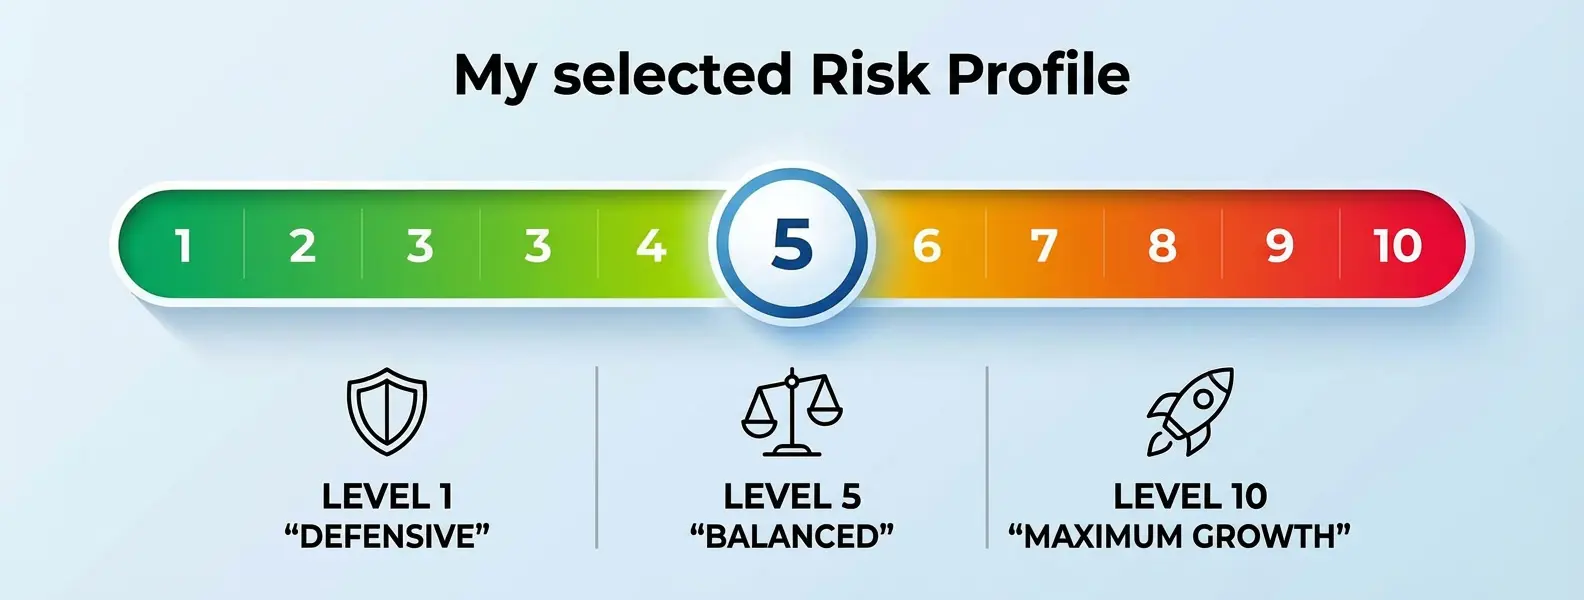
Coming out as a “Level 5 – Balanced” does not mean that all your investments will automatically be placed at this level. Each portfolio will be reviewed in the context of your overall plan, taking into account factors such as your time horizon and objectives. Your natural profile provides the starting point for confirming the most appropriate level of volatility for each investment.
Understanding Risk - Risk in investing doesn't just mean the value of your portfolio going up and down. Market volatility is part of it — and we'll come to that in a moment — but there are other risks that matter too.
Take cash in the bank as an example. It feels safe, but it carries several risks at once:
- Inflation risk – after tax, your savings might grow at 2% while the cost of living (CPI — groceries, energy, everyday items) might rise at 5%. Your money buys less over time.
- Tax risk – depending on your tax status, much of the interest could be lost to HMRC.
- Concentration risk – all your money is in one asset class, with no diversification.
- Institutional failure risk – while rare, financial institutions can fail (as we almost saw in 2008/09).
- Liquidity risk – not all accounts let you access your money straight away. For example, a 5-year fixed savings bond or pension pot can lock your money in until a future date.
So even the "safe" choice has risks.
It's also important to remember that you might have different risk profiles for different goals. For example:
It's also important to remember that you might have different risk profiles for different goals. For example:
- Money set aside for school fees in 3 years should be invested cautiously, because you'll need it soon.
- Money invested for retirement in 20 years can usually take more risk, because you have time to ride out the ups and downs.
Your risk questionnaire result gives us a picture of how you naturally feel about investing, but when building your financial plan we match the right level of risk to each goal.
Step 2: Volatility - Building/selecting the right portfolio
Your questionnaire result measures how you feel about volatility — the normal ups and downs in the value of investments. This is different from the wider risks we looked at earlier (like inflation or liquidity). Volatility is what you actually see when you check your portfolio: some years it's up, some years it's down. The key point is that volatility is not the same as risk of permanent loss. In fact, staying invested through volatile times has historically rewarded patient investors.
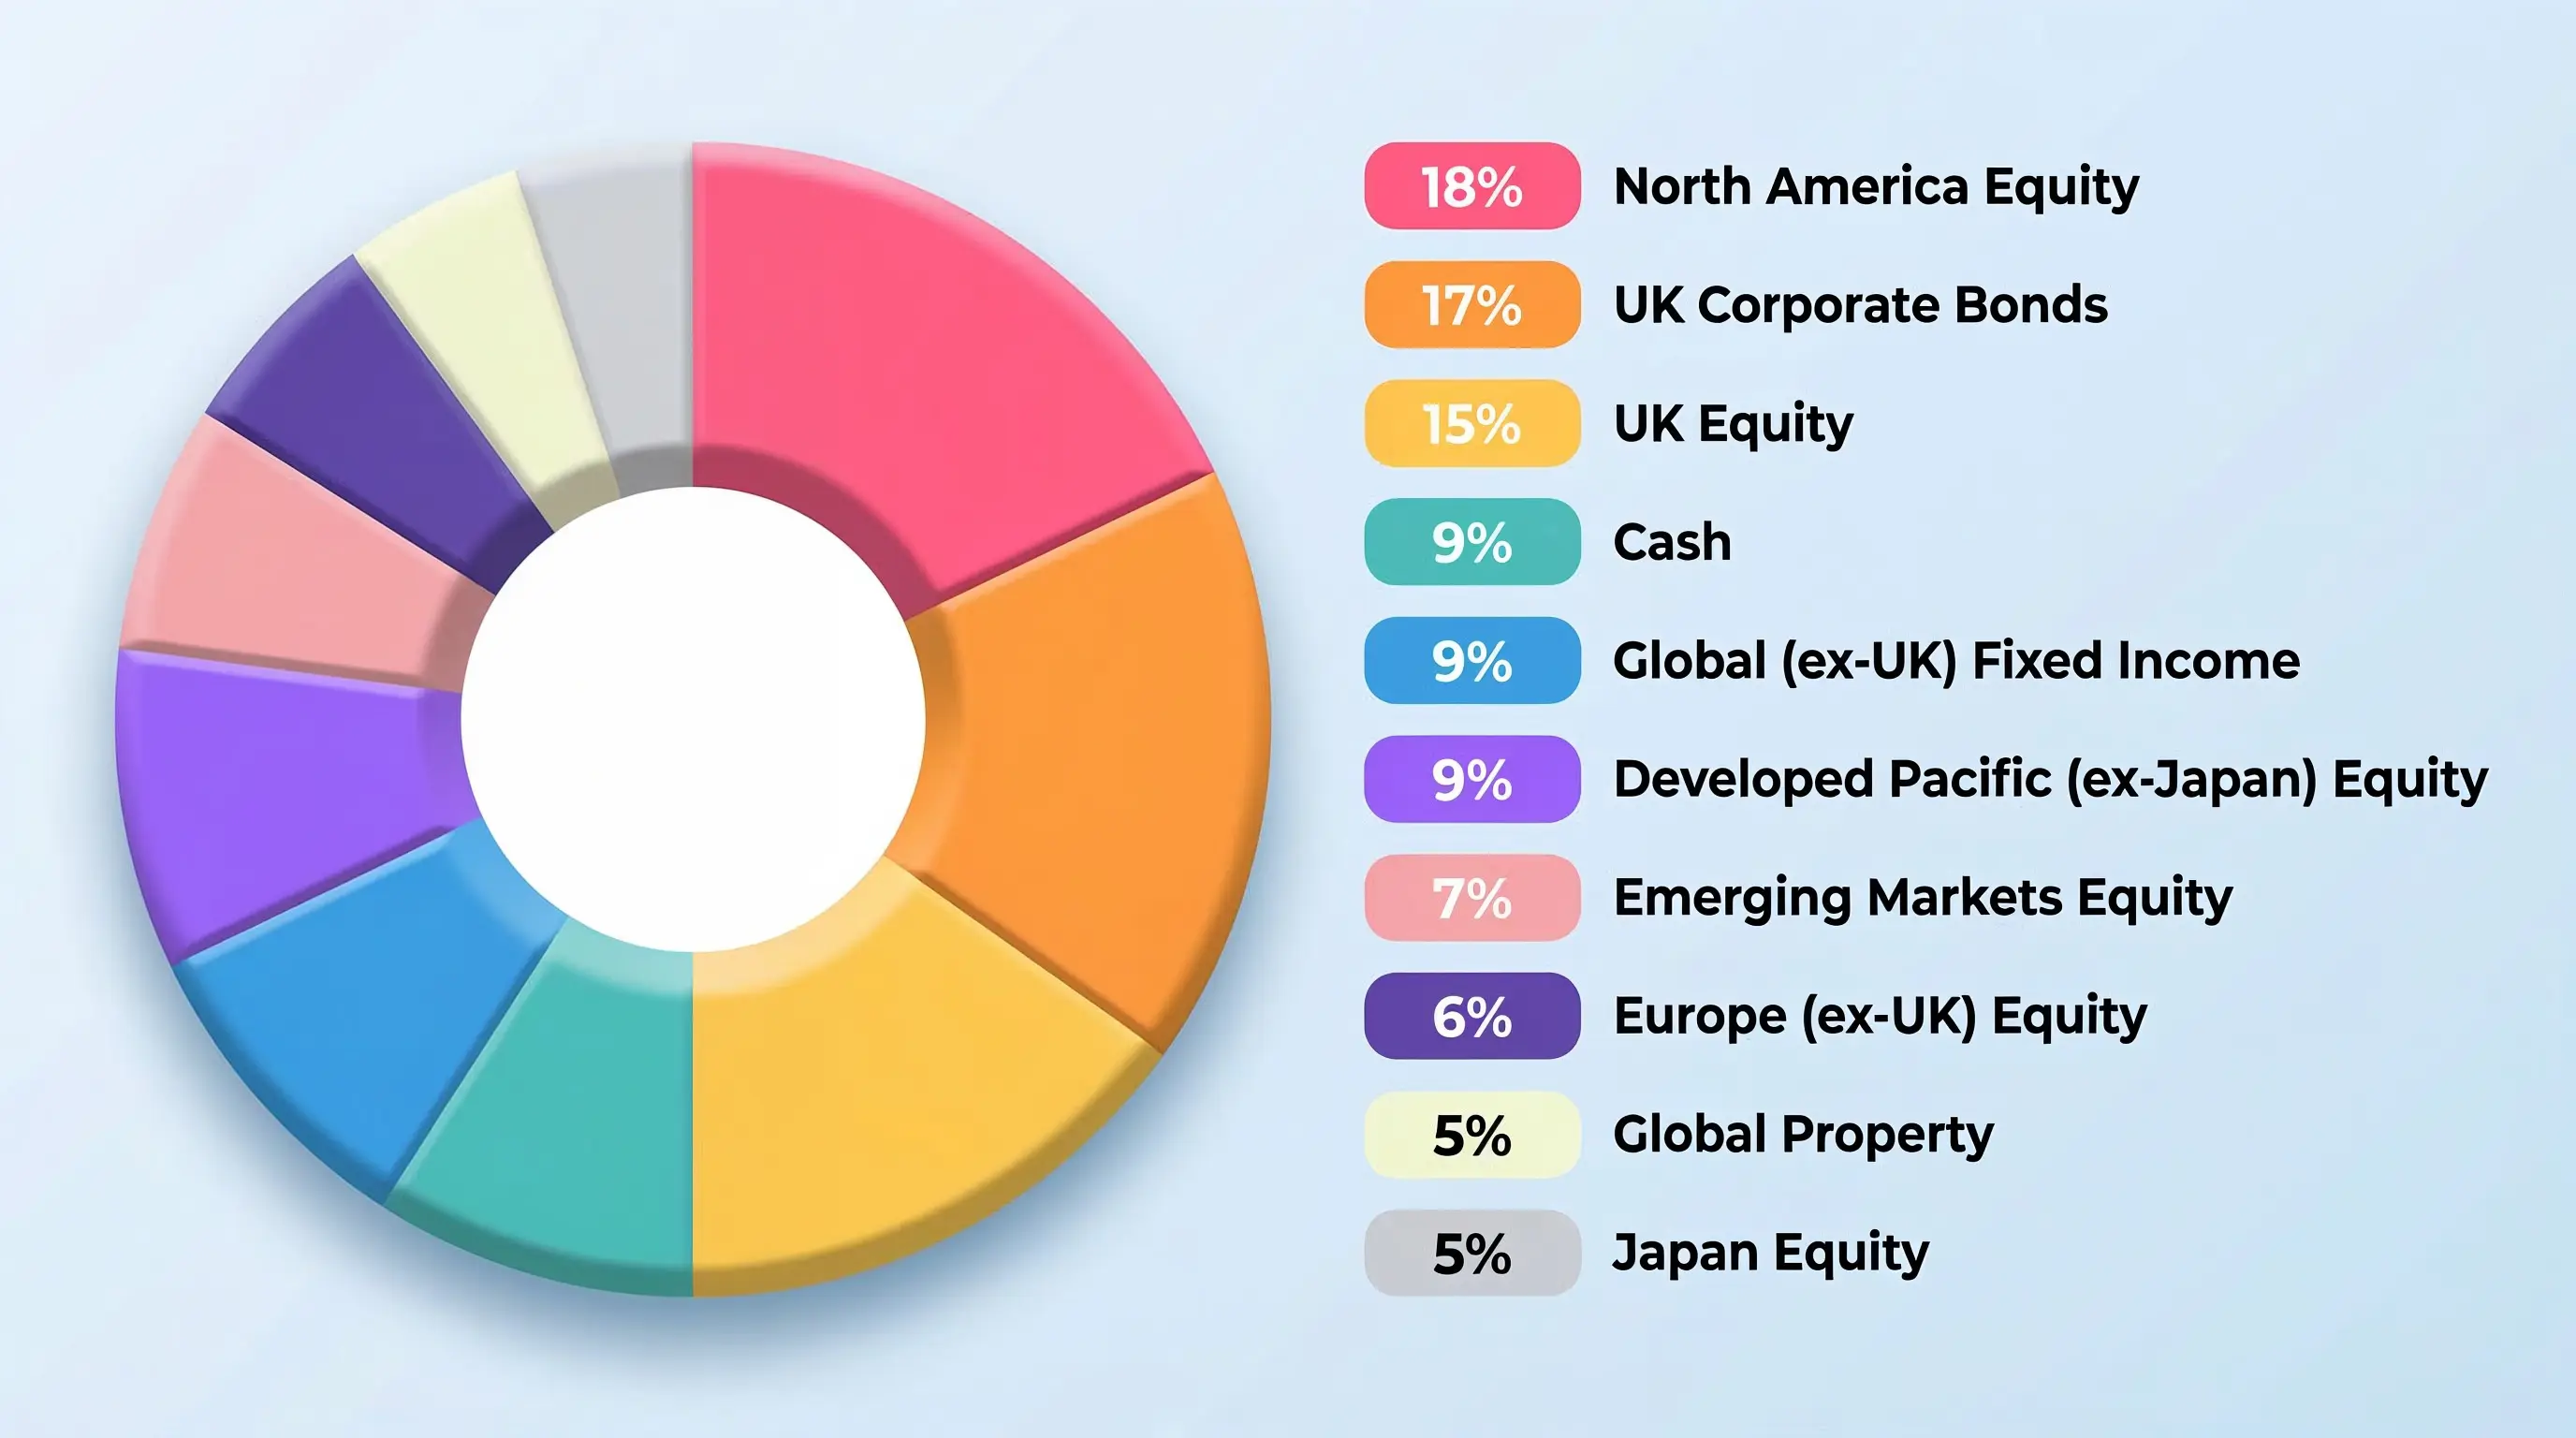
What might your portfolio comprise of? At Volatility Level 5, a typical portfolio might look like this (the percentages will change over time depending on what is happening in the world.
The portfolio holds a majority in global equities and property, complemented by bonds and cash. It is designed to deliver long-term growth while smoothing returns through diversification across “asset classes”.
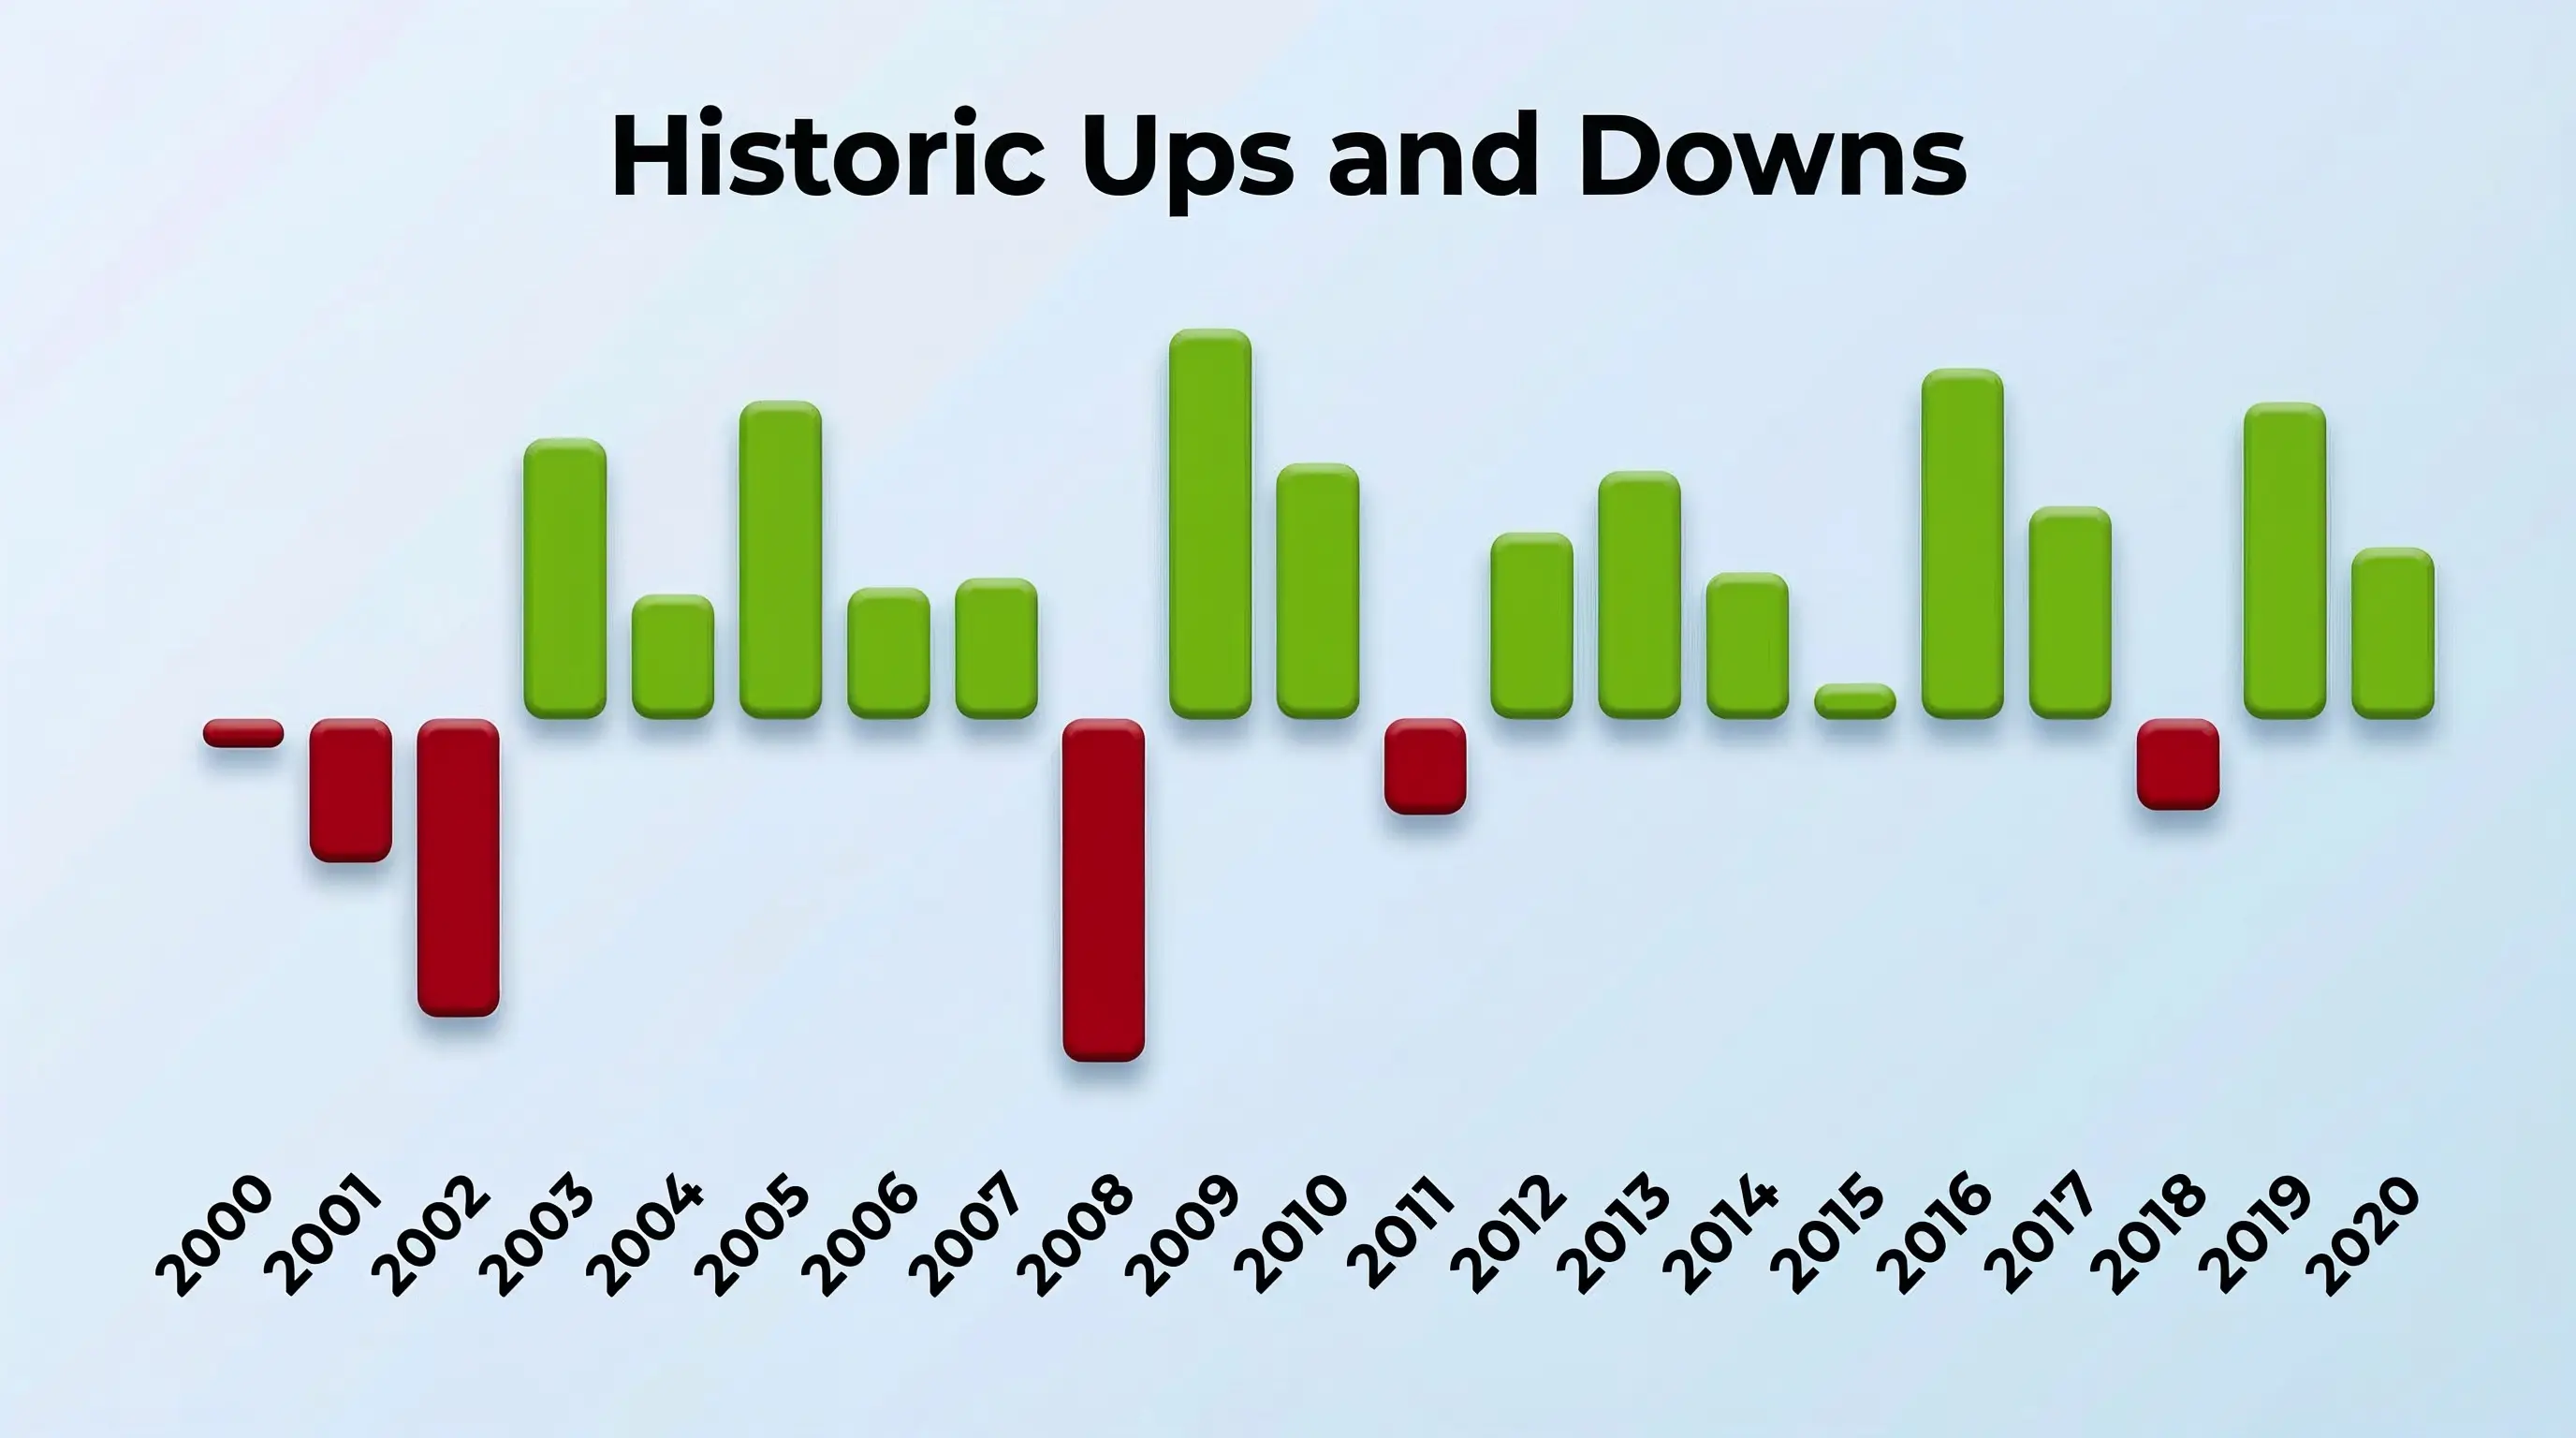
This chart shows how a Volatility Level 5 portfolio would have performed from 2000 to 2020. It highlights key global market events that show how portfolios respond in turbulent times:
- Dot-com crash (2000–2002): three consecutive years of losses ( -1.67%, -8.65%, -18.14% )
- Global Financial Crisis (2008): down approximately -20.9%
- Post-crisis rebound (2009): up +23.26% the next year
- Eurozone debt crisis (2011): another negative year ( -5.73% )
- Trade tensions & rate hikes (2018): equities dropped sharply ( -5.49% )
- COVID-19 (2020): global markets fell -30% in a month , but recovered fully by year-end
Why we use 2000–2020 (inclusive)
We show this 21-year period not because it's special, but because it looks like any other long stretch of market history. Whichever years you pick, you'll find big shocks and strong recoveries. This one just happens to include the dot-com crash, the Global Financial Crisis, the Eurozone debt crisis, trade tensions, and COVID-19 — a good reminder that setbacks come in many forms, but none last forever.
We show this 21-year period not because it's special, but because it looks like any other long stretch of market history. Whichever years you pick, you'll find big shocks and strong recoveries. This one just happens to include the dot-com crash, the Global Financial Crisis, the Eurozone debt crisis, trade tensions, and COVID-19 — a good reminder that setbacks come in many forms, but none last forever.
After all the ups and downs of 2000 to 2020, what did a Level 5 portfolio actually deliver?
- The annualised return over this full 21-year period was about +8.72% per year
- Even starting at the peak of the dot-com bubble, long-term investors who stayed invested were rewarded with strong growth
- The strongest recovery years — 2003, 2009, and others — more than made up for the downturns along the way
Step 3: Matching you to and reviewing that Portfolio
Finally, we match you to the portfolio that best fits your risk profile.
This means:
- Your investments align with your comfort level
- The level of expected volatility suits you
- Your portfolio supports your long-term goals
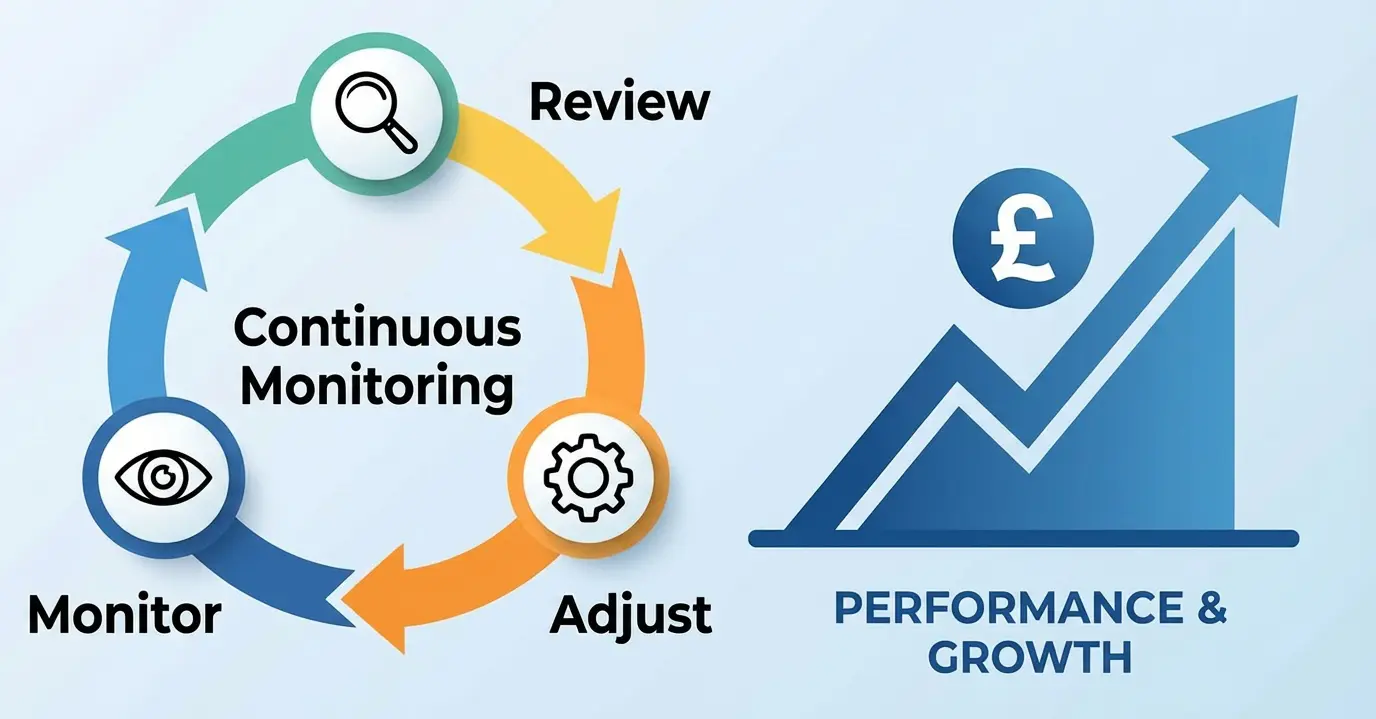
We review this regularly to ensure it continues to meet your needs as circumstances change:
All portfolios are subject to continuous monitoring within a structured governance framework. The objective is to ensure that every portfolio remains aligned with its stated objectives, risk profile and cost expectations — and that performance continues to stand up to independent, external comparison. Both absolute and risk-adjusted returns are measured, focusing on stability and efficiency through changing market conditions rather than short-term performance. Ongoing charges, transaction costs and platform fees are also monitored continuously to confirm that clients receive fair value and that total expenses remain competitive.